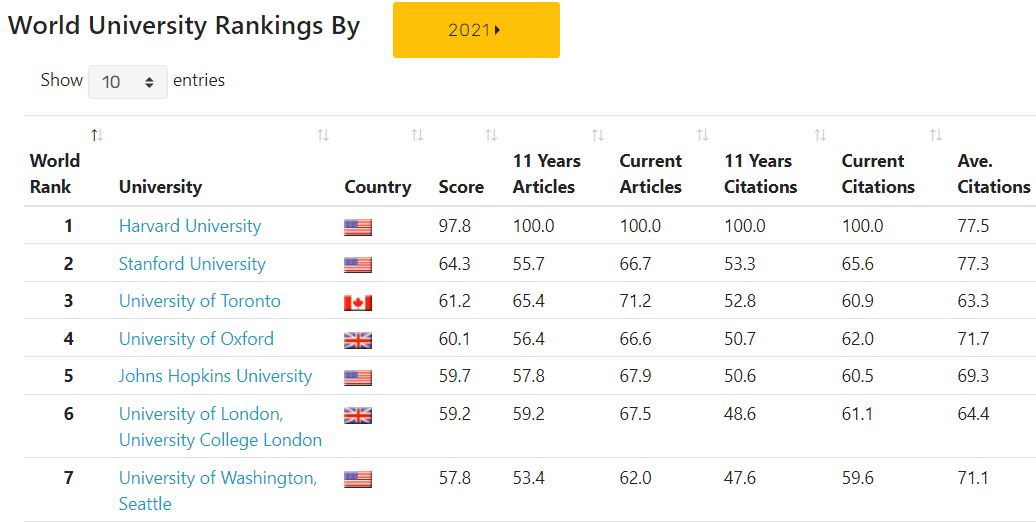
1. Data Visualization_ Radar chart
On NTU Ranking website, we offer a data visualization function to engage our users. The radar chart enables users to interpret data more easily than other types of graphs and charts. It represents the distribution of indexes of each institution. By clicking on the row of the institution, the website will map each index onto the radar chart displaying on the right-hand side. It acts as a useful tool for leaders of universities to glance at the university’s overall performance and to further plan their future development strategies.
For instance, when a user wants to know about the indicator performance of Stanford University, he can quickly do so by looking at the distribution of indexes after clicking on the row where the university lies.
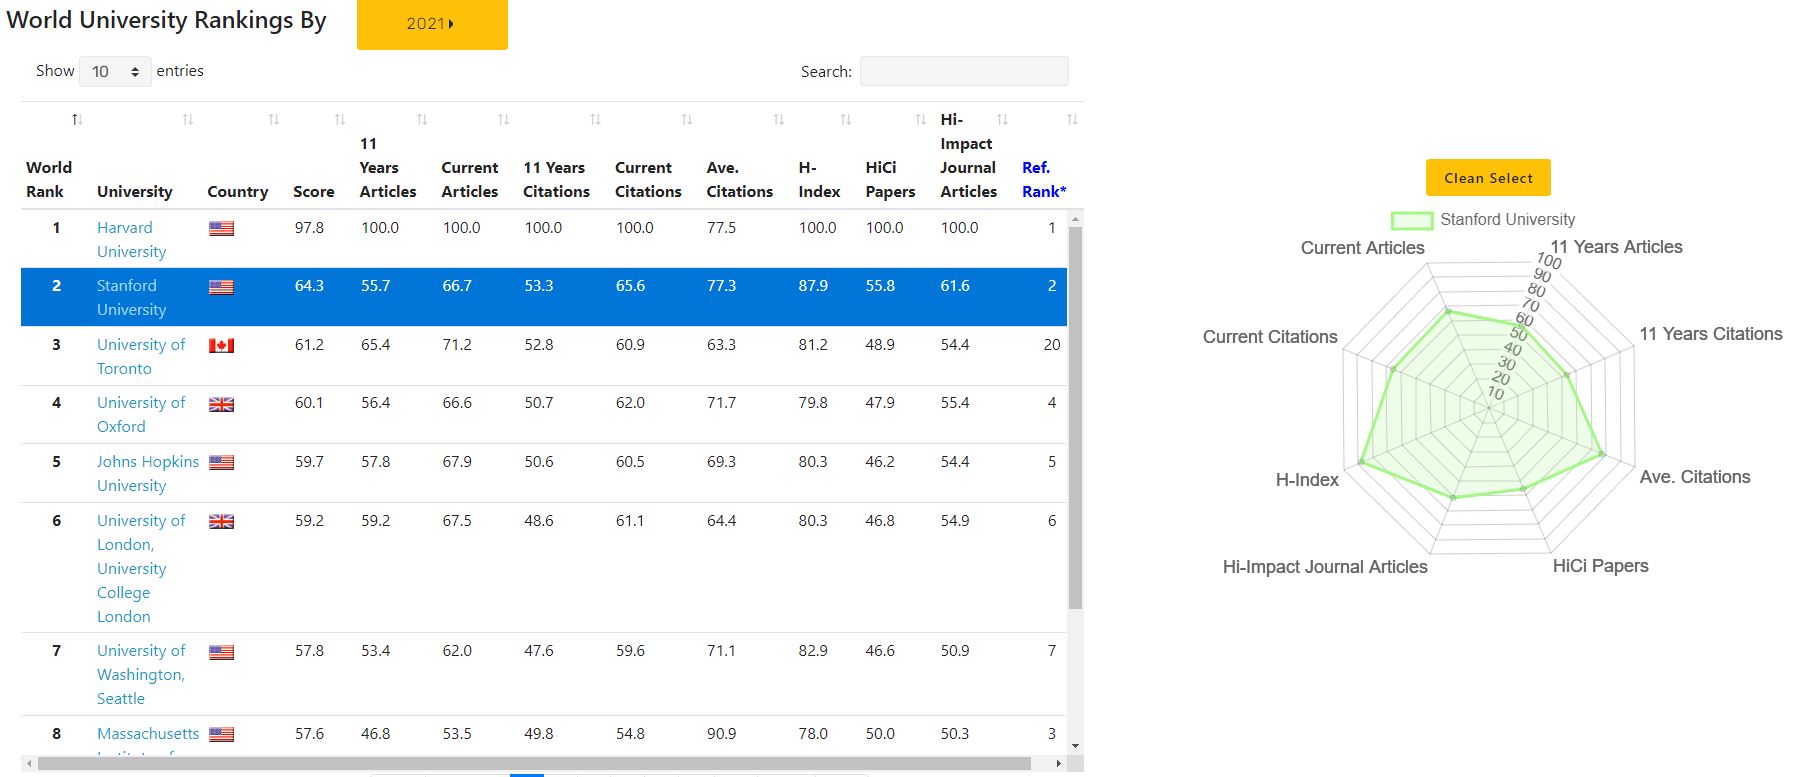
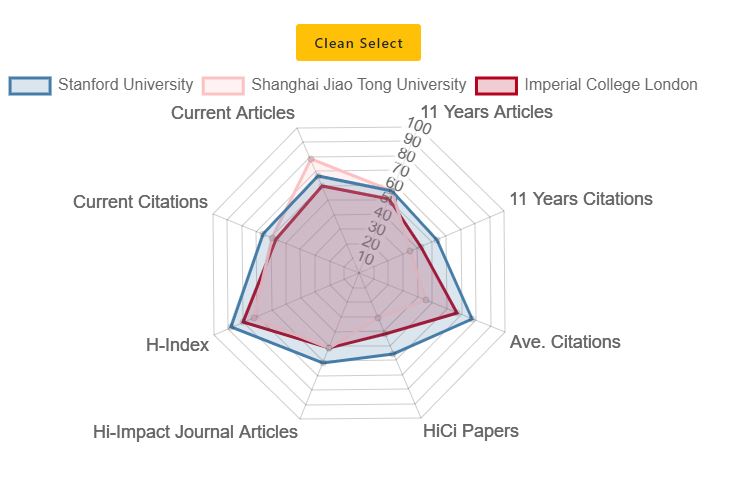
Another powerful feature of our website is the ability to compare different institutions easily. Users can simultaneously select up to 5 institutions at a time in accordance to their needs. Users can quickly compare institutions and understand the relative strengths of each university; this function also provides leaders of universities useful insights on planning future strategies.
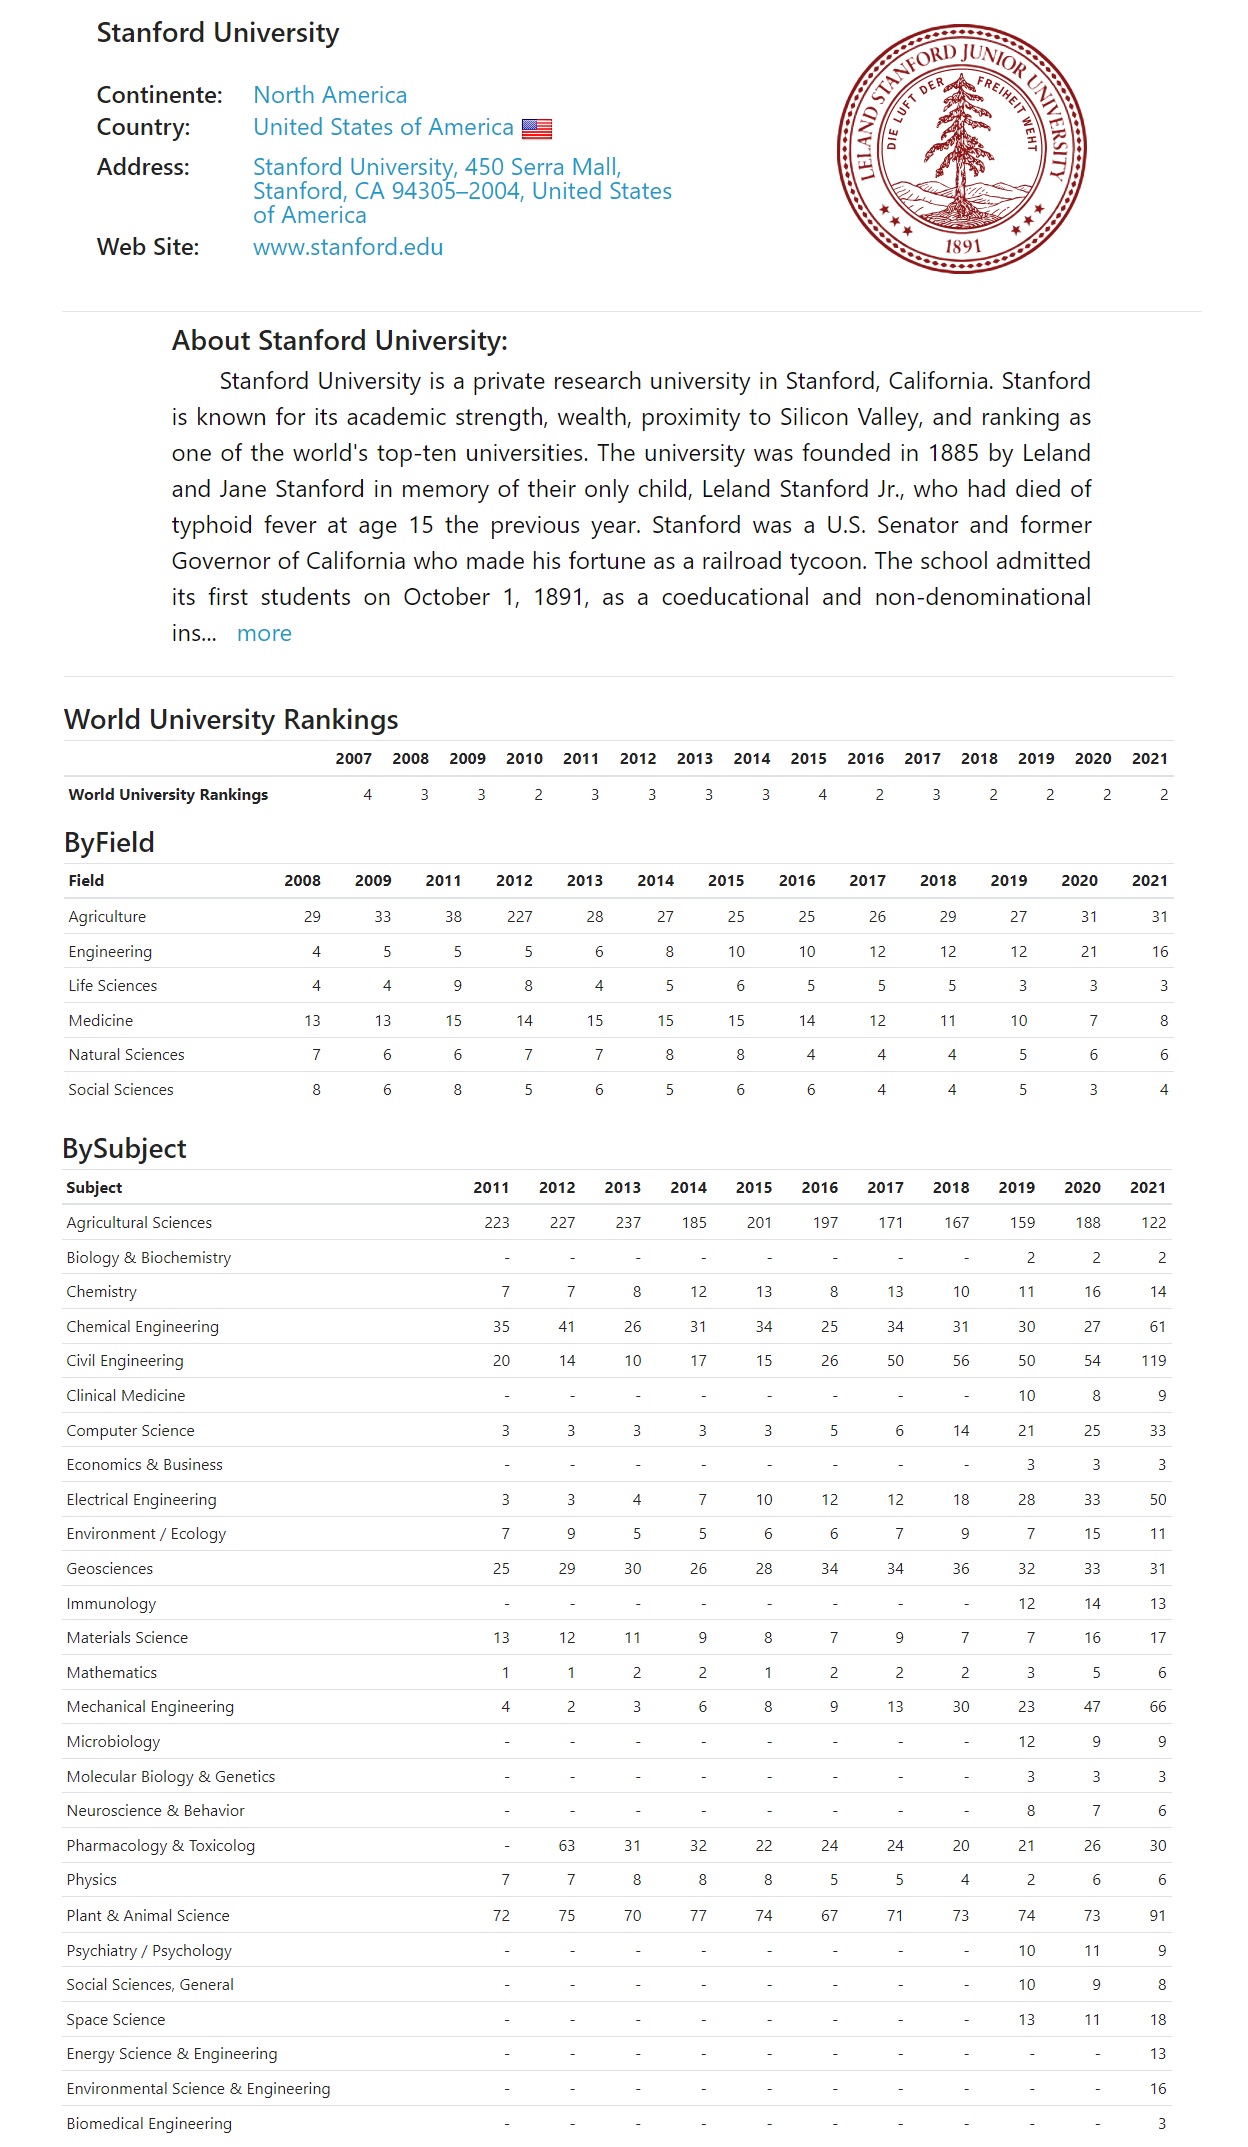
2. Comprehensive Database
By clicking on the title of the institutions, users can access the historical ranking data of specific institutions. For instance, users interested in information about Stanford University can click on the university title, they will land on the page of university information and historical ranking data.